
 By TechOriginHub Editorial Team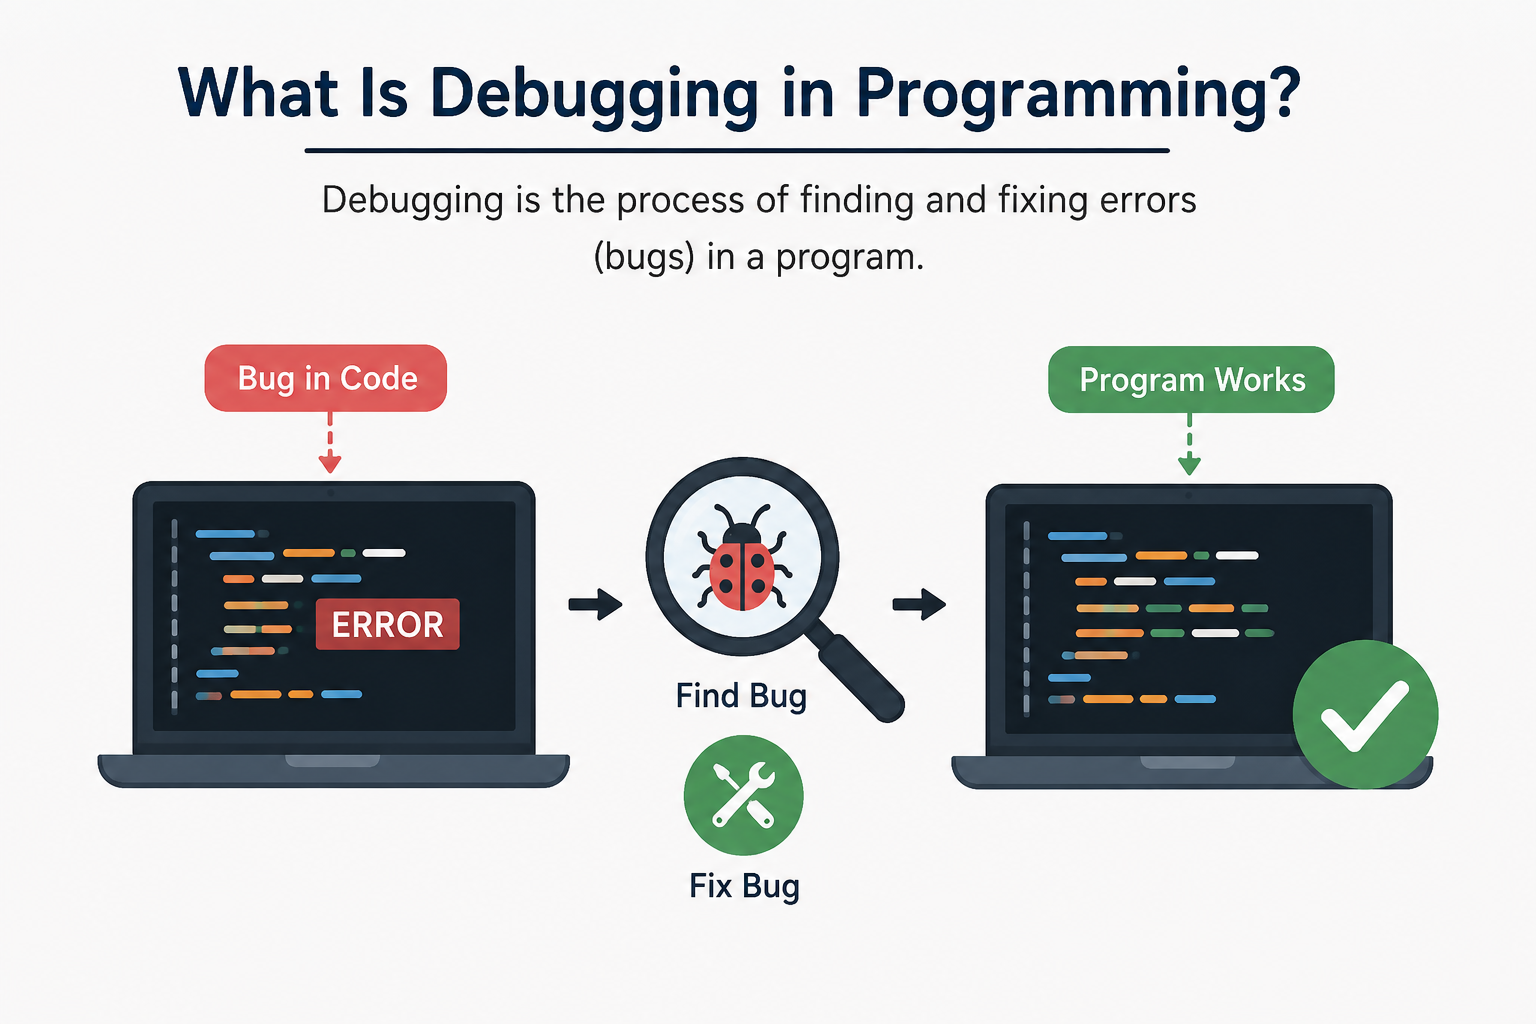
Introduction
You write your code, run it, and something goes wrong. The output is not what you expected. The program crashes. Or it runs fine but produces the wrong result. Every programmer, from complete beginners to experienced professionals, faces this situation regularly.
This is where debugging comes in. Debugging in programming is the process of finding, understanding, and fixing defects or unexpected behavior in software. It is not just about spotting typos in your code. It involves investigating why a program behaves differently from how you intended, tracing the problem to its root cause, and making a targeted fix.
Think of it like being a detective. Something went wrong, and your job is to figure out exactly what happened, why it happened, and how to make sure it does not happen again.
Quick Answer for Featured Snippet
Debugging in programming is the process of identifying, investigating, and fixing errors or unexpected behavior in software. It involves reading error messages, examining code, reproducing problems, tracing their root causes, and applying targeted fixes. Debugging is a core skill in software development and an essential part of writing reliable, working programs.
What Is Debugging in Programming?
Debugging is the process of locating and resolving problems in software so that the program behaves as intended. The word comes from an early computing story where an actual moth was found causing a malfunction in a computer relay. The process of removing it was called debugging, and the term stuck.
In everyday software development, debugging is far broader than fixing spelling mistakes in code. A developer might need to investigate why a calculation produces the wrong result, why an application crashes under certain conditions, why data is not being saved correctly, or why a feature works on one device but not another.
Debugging involves a combination of reading error messages, checking program output, reviewing source code, using diagnostic tools, and applying careful reasoning. It is closely connected to other development activities like testing, logging, and code review, but debugging specifically focuses on finding and fixing the underlying cause of a problem.
If you are new to computer programming, debugging is one of the first practical skills you will develop. The ability to diagnose and fix problems in your own code is just as important as knowing how to write it in the first place.
What Is a Bug in Programming?
A software bug is any defect, error, or flaw in a program that causes it to behave incorrectly or produce unexpected results. Bugs can range from minor cosmetic issues to serious problems that cause data loss, security vulnerabilities, or complete system failures.
Bugs can appear for many reasons. A developer might misunderstand a requirement, make a typing mistake, use incorrect logic, or overlook an edge case that only appears under specific conditions.
It helps to understand a few related terms:
- An error is typically a specific mistake in code that prevents it from running as expected, such as a syntax mistake or an operation on incompatible types.
- A bug often refers more broadly to any defect in behavior, whether the code runs or not.
- A defect is a problem found during development or testing.
- A failure is what a user experiences when a bug causes incorrect behavior in a running system.
These terms overlap in practice, and different teams use them differently. What matters most is understanding that bugs cause programs to behave incorrectly, and debugging is the process of finding out why.
Why Is Debugging Important?
Debugging is not just a frustrating necessity. It serves several important purposes in software development.
Finding the cause of incorrect behavior is the most obvious benefit. When a program does not work correctly, debugging helps you understand exactly what is going wrong and why, rather than guessing.
Fixing software defects is essential for releasing reliable software. Unresolved bugs can cause poor user experiences, data problems, or security risks.
Improving reliability comes from fixing bugs systematically. A debugged program is more predictable and trustworthy.
Preventing repeated problems is possible when debugging reveals the root cause. Understanding why something went wrong helps you avoid similar mistakes in the future.
Understanding unfamiliar code is another practical benefit. Debugging often requires you to read and trace through code carefully, which deepens your understanding of how it works.
Supporting testing and maintenance is closely connected to debugging. When tests reveal unexpected behavior, debugging is what determines the cause and solution.
It is worth being clear: debugging can significantly reduce the number and impact of software defects, but no debugging process can guarantee that all bugs in a program will be found and fixed. Writing well-structured code, using testing, and following good development practices all contribute to reducing bugs over time.
How Does Debugging Work?
Debugging is rarely a single action. It is a process that involves several steps, and experienced developers move through these steps deliberately rather than jumping straight to changing code.
1. Identify the Problem
Start by understanding what is actually wrong. What did you expect to happen? What happened instead? Being precise about the difference between expected and actual behavior makes everything that follows easier.
2. Reproduce the Problem
Before changing anything, try to reproduce the problem consistently. If you can make the bug happen reliably under known conditions, you have a much better chance of understanding and fixing it. A bug you cannot reproduce is very difficult to investigate.
3. Gather Evidence
Collect information about what the program is doing. Read error messages carefully. Check log output. Note what inputs trigger the problem and which ones do not. More information leads to better hypotheses.
4. Locate the Cause
Use your evidence to narrow down where in the code the problem originates. This might involve reading code carefully, adding print or log statements, using a debugger, or testing specific parts of the program in isolation.
5. Test a Possible Fix
Once you have a theory about the cause, make a targeted change to address it. Avoid changing multiple things at once, as this makes it harder to know which change actually solved the problem.
6. Verify the Fix
After making the change, confirm that the problem no longer occurs. Test the specific scenario that triggered the bug and check that the program now produces the correct result.
7. Check for Side Effects
A fix that solves one problem can sometimes introduce another. Check that the rest of the program still behaves correctly after your change, particularly any functionality closely related to what you modified.
Types of Programming Errors
Programming errors fall into several broad categories. Different programming languages handle these categories in their own ways, so the exact behavior can vary, but the general concepts are widely applicable.
| Error Type | What It Means | When It Usually Appears | Simple Example | Typical Way to Investigate |
|---|---|---|---|---|
| Syntax Error | Code breaks the rules of the language’s grammar | Before or at the start of execution | Missing colon, unclosed bracket | Read the error message and line reference |
| Runtime Error | An error that occurs while the program is running | During execution | Division by zero, file not found | Check the traceback and input values |
| Logical Error | Program runs but produces an incorrect result | During testing or use | Subtracting when addition was intended | Check expected vs actual output, trace logic |
| Type-Related Error | A value is used in an operation inappropriate for its type | At runtime or during static checking (language-dependent) | Treating a string as a number | Check variable types and data being passed |
Syntax Errors
A syntax error occurs when code violates the grammatical rules of the programming language. The program cannot be run until the syntax error is corrected, because the language cannot understand the instruction.
Many modern development environments and language tools can identify syntax problems as you type or before the program runs. The error message usually includes the line number where the problem was detected, though the actual mistake is sometimes on a nearby line.
Runtime Errors
A runtime error occurs while the program is actually running. The code may be syntactically correct, but something unexpected happens during execution, such as attempting to divide a number by zero, accessing a file that does not exist, or trying to use a value that is missing.
Runtime errors usually cause a program to stop unexpectedly and typically produce an error message or traceback describing what went wrong and where.
Logical Errors
A logical error is perhaps the trickiest type to find. The program runs without crashing, but it produces an incorrect result. There is no error message to guide you. The code does something, just not what was intended.
For example, a program that should calculate an average by summing values and dividing by the count might instead sum the values and divide by the wrong number. The program runs successfully and produces output, but the output is wrong.
Semantic and Type-Related Problems
Some errors relate to using values or operations in ways that do not make sense for the data involved. For example, trying to add a number and a piece of text together in a way the language does not support. How these are handled varies significantly between programming languages. Some languages catch type-related problems before the program runs, while others only encounter them during execution.
Common Programming Errors and How to Fix Them
Undefined or Unrecognized Variables
What causes it: Using a variable before it has been assigned a value, or misspelling a variable name.
# Example in Python
print(total)  # NameError: name 'total' is not defined
Fix: Make sure every variable is defined before it is used. Check spelling carefully.
total = 100
print(total)  # 100
Prevention: Use meaningful variable names and organize your code so definitions come before use.
Incorrect Syntax
What causes it: Missing punctuation, unclosed brackets, incorrect indentation (particularly in Python), or other grammar violations.
# Example in Python
if x > 10
    print("Greater")  # SyntaxError: expected ':'
Fix: Add the missing colon and check the surrounding code.
if x > 10:
    print("Greater")
Prevention: Use a code editor with syntax highlighting and real-time error detection.
Wrong Variable Type
What causes it: Performing an operation on a value of the wrong type, such as trying to add a string and a number.
# Example in Python
age = "25"
print(age + 5)  # TypeError: can only concatenate str (not "int") to str
Fix: Convert the value to the correct type first.
age = "25"
print(int(age) + 5)  # 30
Off-by-One Errors
What causes it: Loop or index boundaries that are one step too many or too few. Very common when working with lists and ranges.
# Example: intending to print items 1 through 5
for i in range(1, 5):  # Only goes to 4
    print(i)
Fix: Check the boundary conditions carefully.
for i in range(1, 6):  # Correctly goes to 5
    print(i)
Infinite Loops
What causes it: A loop condition that never becomes false, causing the loop to run indefinitely.
# Example in Python
count = 0
while count < 10:
    print(count)
    # count is never incremented, so the condition stays True
Fix: Make sure the condition will eventually become false.
count = 0
while count < 10:
    print(count)
    count += 1
Understanding how loops in programming work is essential for avoiding this type of error.
Incorrect Conditions
What causes it: Using the wrong comparison operator or logical condition.
# Checking equality instead of assignment
if x = 10:  # SyntaxError in Python; in some languages this is a logic bug
Fix: Use the correct operator for the intended operation.
if x == 10:
    print("x is ten")
Null or Missing Values
What causes it: Attempting to use a value that is None (in Python) or equivalent in other languages, without checking whether it exists first.
name = None
print(name.upper())  # AttributeError: 'NoneType' object has no attribute 'upper'
Fix: Check for None before using the value.
name = None
if name is not None:
    print(name.upper())
Incorrect Function Arguments
What causes it: Calling a function with too many arguments, too few, or arguments in the wrong order.
def greet(name, greeting):
    print(f"{greeting}, {name}!")

greet("Hello")  # TypeError: missing 1 required positional argument
Fix: Match the arguments to the function’s definition.
greet("Alice", "Hello") # Hello, Alice!File or Resource Errors
What causes it: Trying to open a file that does not exist, using an incorrect path, or not handling the case where a resource is unavailable.
with open("data.txt") as f:  # FileNotFoundError if the file does not exist
    content = f.read()
Fix: Check that the file exists, use the correct path, and handle the case where it might not be available.
Incorrect Calculations
What causes it: Using the wrong arithmetic operator, incorrect order of operations, or incorrect formula.
# Calculating average incorrectly
total = 90
count = 3
average = total + count  # Should be total / count
Fix: Verify formulas carefully and test with known values to confirm the output is correct.
API or Network Request Failures
What causes it: Using an incorrect endpoint, missing authentication, sending malformed request data, or not handling error responses.
Fix: Check the status code returned, verify the endpoint and request format, and confirm that authentication credentials are correct. Understanding how APIs work helps significantly when debugging web requests.
Example of Debugging a Simple Program
Here is a practical walkthrough of debugging a short Python program.
The Original Code:
def calculate_average(numbers):
    total = 0
    for num in numbers:
        total += num
    average = total / len(numbers)
    return average

scores = [85, 90, 78, 92, 88]
result = calculate_average(scores)
print(f"Average: {result}")
The Unexpected Result:
Running this code works correctly for this input. But suppose the function is called with an empty list:
scores = []
result = calculate_average(scores)
This produces a ZeroDivisionError: division by zero because len([]) is zero.
Identifying the Problem:
The error message points to average = total / len(numbers). The problem is that the function does not handle the case where the list is empty.
The Corrected Code:
def calculate_average(numbers):
    if len(numbers) == 0:
        return None  # Or raise an appropriate exception
    total = 0
    for num in numbers:
        total += num
    average = total / len(numbers)
    return average

scores = []
result = calculate_average(scores)
if result is None:
    print("No scores provided.")
else:
    print(f"Average: {result}")
Why the Correction Works:
The corrected version checks whether the list is empty before attempting the division. This is called handling an edge case, a situation that sits at the boundary of normal input. Testing with unexpected inputs, not just typical ones, is an important part of finding these kinds of problems.
Common Debugging Techniques
Reading Error Messages
Error messages and tracebacks contain a great deal of useful information. They typically tell you what went wrong, where in the code it happened, and sometimes why. Reading error messages carefully, rather than skipping past them, is one of the most effective debugging habits to develop.
Using Print or Logging Statements
Adding print statements to your code lets you see the value of variables and the flow of execution at specific points. This is one of the simplest and most widely used debugging techniques. For more permanent and structured output, logging libraries are a better choice than print statements in production code.
Using a Debugger
A debugger is a tool that lets you pause program execution at specific points and examine what is happening inside the program at that moment. Debuggers are available in most development environments and provide far more control than print statements alone.
Setting Breakpoints
A breakpoint tells the debugger to pause execution at a specific line of code. When the program reaches that line, it stops and lets you inspect the current state before continuing.
Stepping Through Code
Most debuggers allow you to execute code one line at a time. This lets you follow the exact path your program takes and watch how variables change with each step.
Inspecting Variables
While paused at a breakpoint, you can examine the current value of any variable in scope. This is extremely useful for catching situations where a variable contains an unexpected value.
Checking Program State
Beyond individual variables, debuggers and logging can help you understand the overall state of a program at a given point: what data is loaded, what functions have been called, what branches were taken.
Reproducing the Error
Before investigating, confirm that you can make the problem happen consistently. A bug you can reproduce reliably is much easier to investigate than one that appears unpredictably.
Simplifying the Problem
If a bug is appearing in complex code, try to isolate it. Remove or comment out unrelated sections and test the smallest possible piece of code that still shows the problem.
Testing One Change at a Time
When applying fixes, change one thing at a time and test after each change. Changing multiple things simultaneously makes it very difficult to know which change actually resolved the problem.
Reviewing Recent Code Changes
If something was working before and is now broken, look at what changed recently. Version control history, which is covered further below, makes this much more straightforward.
What Is a Debugger?
A debugger is a specialized tool that allows developers to run a program in a controlled way, pause execution at specific points, and inspect what the program is doing internally at that moment.
Running a program normally gives you only the output it produces. A debugger gives you a window into the program’s execution, letting you see variable values, the sequence of function calls, and the exact path the code takes through different conditions.
Breakpoints are markers you set on specific lines of code. When the running program reaches a breakpoint, it pauses and waits for your instruction.
Step over executes the current line and moves to the next one without entering any function calls on that line.
Step into moves inside a function call on the current line so you can follow its execution.
Step out finishes executing the current function and returns to the point where it was called.
Variable inspection lets you view the current value of any accessible variable while the program is paused.
A call stack shows you the sequence of function calls that led to the current point in execution. If you are inside a function that was called by another function, the call stack shows you that chain. This is particularly useful for understanding how the program arrived at a particular point.
Debuggers are built into most integrated development environments. If you are using Visual Studio Code as your editor, it includes a capable built-in debugger that works with Python, JavaScript, and many other languages.
Popular Debugging Tools
Visual Studio Code Debugging — VS Code includes a built-in debug panel that supports multiple languages. You can set breakpoints, step through code, inspect variables, and view the call stack directly within the editor. The official Visual Studio Code documentation provides detailed guidance on its debugging features.
Python Debugger (pdb) — Python includes a built-in command-line debugger called pdb. You can invoke it within your code or from the command line. Python 3.7 and later also supports the breakpoint() function as a convenient way to enter the debugger at a specific line.
Browser Developer Tools — Every modern browser includes built-in developer tools accessible through a keyboard shortcut or right-click menu. These tools are invaluable for debugging JavaScript, inspecting HTML and CSS, monitoring network requests, and viewing console output.
Chrome and Edge DevTools — The Sources panel in Chrome and Edge DevTools allows you to set breakpoints in JavaScript, step through code, and inspect variables, all within the browser. The Network panel lets you inspect API requests and responses in detail.
IDE Debugging Features — Most modern integrated development environments include visual debuggers. An IDE typically integrates the debugger directly into the code editor, making it easy to set breakpoints by clicking in the margin next to a line of code.
Logging Tools — Python’s built-in logging module and similar libraries in other languages provide structured, level-based logging. Logging is generally preferable to print statements for ongoing debugging and monitoring in production environments.
No single debugging tool is universally best. The right tool depends on the language you are using, the environment your code runs in, and the nature of the problem you are investigating.
Debugging vs Testing
Debugging and testing are related but serve different purposes. Understanding how they differ helps you know when to use each approach.
| Aspect | Debugging | Testing |
|---|---|---|
| Main purpose | Investigate and fix the cause of a known problem | Verify that software behaves correctly |
| Typical activities | Tracing errors, inspecting variables, applying fixes | Writing test cases, running tests, comparing results |
| When it is used | After unexpected behavior or a failure is observed | Throughout development and before releases |
| Tools | Debuggers, log output, print statements | Testing frameworks, test runners, continuous integration |
| Example | Tracing why a calculation returns the wrong value | Verifying that the average function returns 85 for a given input |
Testing can reveal that a problem exists. Debugging investigates what the problem is and where it comes from. A test might show that a function returns an unexpected value. Debugging is the process of finding out why and fixing the root cause.
Debugging vs Troubleshooting
These terms are often used interchangeably, but there are useful distinctions for developers to understand.
Debugging specifically refers to finding and fixing problems in code. It is focused on the internal logic and behavior of a program.
Troubleshooting is broader and can include any systematic investigation of a problem, including infrastructure issues, configuration problems, network failures, and user environment differences.
Code review is a different but complementary activity where developers examine each other’s code for quality, correctness, and potential problems before or after merging.
For beginners, the important practical point is this: when something goes wrong, start by gathering information, not by immediately changing code. Whether you call it debugging or troubleshooting, the systematic approach of understanding the problem before acting on it leads to better outcomes.
Best Practices for Better Debugging
Understand the error before changing code. Resist the urge to start modifying code the moment something goes wrong. Take time to understand what the problem actually is.
Reproduce the issue consistently when possible. A reliably reproducible bug is far easier to investigate. Try to identify the exact conditions that trigger the problem.
Read the full error message. Error messages often contain the file name, line number, and a description of the problem. Reading them carefully saves significant time.
Check recent changes. If something worked before and now does not, look at what changed. Version control history is extremely useful here.
Use small, controlled changes. Apply one fix at a time and test after each change.
Use meaningful logging. Log messages that include context, such as which function is running and what values are being processed, are far more useful than generic messages.
Use version control. Tracking your code with Git lets you compare current code to earlier versions, helping you identify when and where a problem was introduced.
Test fixes properly. After applying a fix, test the scenario that was failing and check that related functionality still works.
Review edge cases. Many bugs appear at the boundaries of expected input, such as empty lists, zero values, or very large numbers.
Ask for help with a clear problem description. When you are stuck, describing the problem clearly to a colleague or community often leads to a solution. Being specific about what you expected, what happened instead, and what you have already tried makes it much easier for others to help.
Common Debugging Mistakes Beginners Make
Ignoring error messages. Error messages are your most direct source of information about what went wrong. Reading them carefully is almost always the best first step.
Guessing instead of investigating. Randomly changing code in the hope of fixing a bug often creates new problems without solving the original one. Follow a systematic approach.
Changing too many lines at once. Making multiple changes simultaneously makes it impossible to know which one fixed the problem, or which one introduced a new one.
Fixing symptoms instead of causes. Addressing what a bug looks like rather than why it happens means the underlying problem often reappears in a different form.
Not reproducing the bug. Fixing a bug you have not confirmed you can reproduce is risky. You cannot verify the fix worked if you could not trigger the problem reliably.
Forgetting to test the fix. Always verify that the change actually solved the problem and did not break anything else.
Not checking assumptions. Bugs often arise from incorrect assumptions about what a function returns, what type a value is, or what a condition evaluates to. Verify your assumptions explicitly.
Copying fixes without understanding them. Applying a solution from the internet without understanding why it works can introduce new bugs or leave the root cause unresolved.
Ignoring recent code changes. A problem that suddenly appears often correlates with a recent change. Checking version history is a practical first step.
Failing to use version control. Without version control, it is much harder to compare current code to a version that worked, making debugging significantly more difficult.
How to Debug Code Faster and More Effectively
Start with the smallest piece of code that still shows the problem. Isolating the issue to the minimum amount of code makes it much easier to reason about.
Divide the problem into smaller parts. If you are not sure where the problem is, split the code logically and test each section to narrow down the location.
Verify your inputs and outputs at each step. Do not assume that data flowing through your program is correct. Check what values are actually present at key points.
Compare expected behavior with actual behavior explicitly. Writing down or logging both what you expected and what you observed makes the discrepancy clear.
Search error messages carefully. Pasting an error message into a search engine often leads to documentation, discussion threads, or examples that explain the problem and common solutions.
Review the documentation for any library, function, or API you are working with. Unexpected behavior is sometimes the result of misunderstanding how something is supposed to work, not a bug in your code.
Use tests to confirm fixes. Writing a test that reproduces the bug, fixing the bug, and then confirming the test passes is a reliable way to verify your solution.
These strategies can help make debugging more efficient, though no approach guarantees a quick resolution for every problem. Some bugs take time, patience, and persistence.
Debugging in Python
Python programming provides several tools and techniques for debugging code at all levels.
Tracebacks are Python’s error reports. When a runtime error occurs, Python prints a traceback showing the sequence of function calls that led to the error and the specific line where it occurred. Reading the traceback from the bottom up is usually the most efficient approach, as the most specific error information is at the bottom.
print() is the simplest debugging tool. Adding print() calls to display variable values or confirm which parts of the code are executing is quick and effective for straightforward problems.
The logging module provides a more structured alternative to print statements, with different severity levels (DEBUG, INFO, WARNING, ERROR, CRITICAL) and the ability to direct output to files or other destinations.
breakpoint() is a built-in function available in Python 3.7 and later that drops you into the Python debugger (pdb) at that point in your code.
pdb (Python Debugger) is Python’s built-in interactive debugger. It allows you to step through code, inspect variables, and evaluate expressions at any point during execution.
IDE debugging through environments like Visual Studio Code provides a visual interface for all of the above, making it particularly accessible for beginners.
Exception handling using try and except blocks allows you to catch and respond to runtime errors without crashing the program, which also provides opportunities to log useful diagnostic information.
The official Python documentation covers the Python debugger in detail and is the best reference for current commands and behavior.
Debugging in JavaScript
Debugging JavaScript typically involves a combination of browser developer tools and code-level techniques.
Browser Developer Tools are built into every modern browser. In Chrome, Edge, and Firefox, you can open them with F12 or by right-clicking the page and selecting Inspect. They provide a comprehensive set of debugging features.
The Console displays JavaScript errors, warnings, and output from console.log(). Checking the console is usually the first step when something goes wrong in a web application.
The Sources panel (called Debugger in Firefox) allows you to view your JavaScript files, set breakpoints, and step through code execution. You can pause at any line, inspect variable values, and follow the call stack.
Breakpoints in the browser debugger work the same way as in other environments. Click on a line number in the Sources panel to set a breakpoint. The browser pauses execution when it reaches that line.
The Network panel shows all HTTP requests made by the page, including API calls. You can inspect request and response headers, bodies, and status codes, which is invaluable when debugging web API integrations.
JavaScript-specific errors such as ReferenceError, TypeError, and SyntaxError appear in the console with descriptions and file references. The Chrome DevTools documentation provides detailed guidance on using all of these features.
Debugging APIs and Web Applications
When debugging problems with API calls and web applications, several common issues are worth checking systematically.
Incorrect endpoint — Verify that the URL being called matches the API documentation exactly, including the path, any version prefix, and query parameters.
Wrong HTTP method — Confirm that the request uses the correct method (GET, POST, PUT, DELETE). Using the wrong method often returns a 405 Method Not Allowed response.
Invalid request data — Check that the request body is correctly formatted, fields have the expected names, and values are of the correct type.
Authentication failures — Verify that the API key, token, or other credentials are correctly included in the request headers. A 401 Unauthorized response typically indicates an authentication problem.
Incorrect response handling — Check that your code correctly parses and uses the response. Make sure you are accessing the right fields in the response data.
Unexpected status codes — Every status code carries meaning. A 400 indicates a problem with the request, 401 with authentication, 403 with permissions, 404 with the endpoint, and 500 with the server. Understanding how APIs work is essential for interpreting these codes correctly.
CORS issues — When a browser-based application makes API requests to a different domain, the browser enforces Cross-Origin Resource Sharing (CORS) restrictions. CORS errors appear in the console and indicate that the API server needs to be configured to allow requests from your application’s origin.
Always use the Network panel in browser developer tools when debugging web API calls, as it shows you exactly what was sent and received.
How Git Helps With Debugging
Version control plays a practical role in debugging that many beginners overlook. Using Git gives you a detailed history of every change made to your code, which is invaluable when tracking down bugs.
Reviewing changes through git diff lets you compare the current state of your code with an earlier version, making it much easier to spot what changed.
Comparing versions with git log and related commands lets you browse through commit history to find when a particular piece of code was added or modified.
Identifying when a problem was introduced is possible with tools like git bisect, which helps narrow down the specific commit that caused a regression by systematically checking earlier states of the code.
Reverting problematic changes is straightforward when you have a clear commit history. If a recent commit introduced a bug, you can revert it and restore the working state.
Collaborating safely is easier when everyone on a team works in separate branches and changes are reviewed before merging, which reduces the chance of bugs being introduced into shared code.
It is important to be clear: Git helps you manage and investigate code history, but it does not automatically find bugs or guarantee recovery from every problem. Good commit practices, such as making small focused commits with clear messages, make Git’s debugging capabilities much more useful.
Frequently Asked Questions
What is debugging in programming?
Debugging in programming is the process of identifying, investigating, and fixing errors or unexpected behavior in software. It involves reading error messages, tracing program execution, locating the cause of a problem, applying a fix, and verifying the fix worked correctly.
What is an example of debugging?
A simple example: a function that calculates an average crashes when given an empty list because it tries to divide by zero. Debugging involves reading the error message, identifying the division by zero as the cause, adding a check for an empty list, and testing the fix.
What are the 3 main types of programming errors?
The three main types are syntax errors (incorrect language grammar), runtime errors (errors that occur during execution), and logical errors (code runs but produces an incorrect result). Different programming languages categorize and handle these in their own ways.
What is the difference between a bug and an error?
An error is typically a specific mistake in code, such as a syntax problem or a type mismatch. A bug refers more broadly to any defect that causes unexpected behavior, whether the code runs or not. The terms often overlap in practice.
How do programmers debug code?
Programmers debug code by reproducing the problem, reading error messages and tracebacks, adding logging or print statements, using a debugger to step through code, inspecting variable values, forming and testing hypotheses about the cause, and verifying fixes.
What is a debugger?
A debugger is a tool that lets you run a program in a controlled way, pause execution at specific points called breakpoints, and inspect what the program is doing internally, including variable values, the call stack, and the execution path.
What is a breakpoint in debugging?
A breakpoint is a marker you set on a specific line of code. When the program reaches that line during debugging, it pauses and waits for your instruction, allowing you to inspect the current state before continuing execution.
What is the difference between testing and debugging?
Testing verifies whether software behaves correctly by running it against defined expectations. Debugging investigates the cause of a known problem and applies a fix. Testing can reveal that a problem exists. Debugging determines what the problem is and resolves it.
What is the easiest way to debug code for beginners?
For beginners, the most accessible approach is to read error messages carefully, add print statements to display variable values at key points, and use the debugging features of their code editor or browser developer tools to step through code and inspect what is happening.
Why is debugging important in software development?
Debugging is essential because software rarely works perfectly on the first attempt. It allows developers to find and fix defects, understand how their code actually behaves, improve reliability, and maintain software over time.
Can debugging fix logical errors?
Yes, but logical errors require careful investigation because they do not produce error messages. Debugging logical errors involves comparing expected output with actual output, tracing the logic step by step, and identifying where the reasoning in the code diverges from the intended behavior.
What tools are used for debugging?
Common debugging tools include built-in debuggers in IDEs like Visual Studio Code, Python’s built-in debugger pdb, browser developer tools for JavaScript and web applications, logging libraries, and version control tools like Git for reviewing code history.
References
- Python Documentation. The Python Debugger (pdb). Official Python Software Foundation documentation. https://docs.python.org/3/library/pdb.html
- Python Documentation. Logging HOWTO. Official Python logging module documentation. https://docs.python.org/3/howto/logging.html
- Microsoft Visual Studio Code Documentation. Debugging in Visual Studio Code. https://code.visualstudio.com/docs/editor/debugging
- Chrome Developers. Chrome DevTools Documentation. Google Chrome developer tools reference. https://developer.chrome.com/docs/devtools/
- MDN Web Docs. What went wrong? Troubleshooting JavaScript. Mozilla Developer Network. https://developer.mozilla.org/en-US/docs/Learn/JavaScript/First_steps/What_went_wrong
- MDN Web Docs. Firefox JavaScript Debugger. Mozilla Developer Network. https://firefox-source-docs.mozilla.org/devtools-user/debugger/
- Git Official Documentation. git-bisect. Git reference for using bisect to find regressions. https://git-scm.com/docs/git-bisect
- Microsoft Learn. Debugging techniques and tools. Microsoft developer learning resources. https://learn.microsoft.com/en-us/visualstudio/debugger/
- Python Documentation. Errors and Exceptions. Python tutorial section on error handling. https://docs.python.org/3/tutorial/errors.html
This article is for educational and informational purposes. Programming languages, debugging tools, and development environments evolve over time. Always consult the current official documentation for the language and tools you are using before relying on specific commands or behavior described here.
Author: TechOriginHub Editorial Team
Author Bio: TechOriginHub Editorial Team covers practical technology, programming, software, cybersecurity, cloud computing, databases, and internet topics with a focus on clear and useful guidance.